DAT iQ RateView is designed to help brokers and shippers understand the current market for spot and contract freight. The platform provides access to real-time and historical rates data to support better decision-making across both tactical and strategic freight planning.
Whether you’re a broker quoting freight or a shipper validating rates, managing budget risk, or analyzing routing guide performance, RateView delivers the insights you need — when you need them.

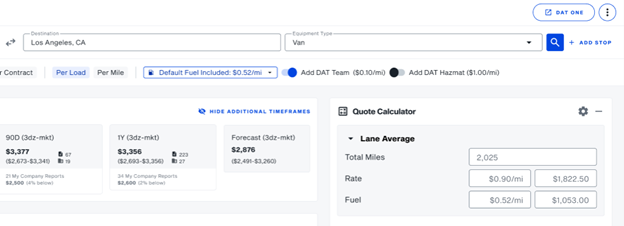
Expanded historical rate cards

Clicking into the rate card reveals additional timeframes — including 3-day, 7-day, 90-day, 1-year, and 35-day forecast — giving both brokers and shippers the context to make informed pricing, procurement, or coverage decisions.
The Best Fit Rate uses the smallest geography and timeframe available, provided there are minimums of 7 reports and 3 companies.
Geo-Expasion

Easily Adjust the geography for more data points.
- 3-digit zip : the first 3 digits of the target city’s primary zip code. I.e., the 3-digit zip for Fresno, CA is 936.
- State: This covers the full state where the Origin and Destination are selected.
- Mkt : Key Market Area. We divide the country into 135 key market areas. When you enter a city name into the search parameters, LaneMakers will search for any posting and searching activity that is within the market area containing the target city. To see a map of the key market areas, click on the Hot Market Map in the tools menu.
- X-Mkt : Extended Market Area. This is a collection of key market areas surrounding the target city.
- Region : the general area of the country containing the target city.
Forecast rate card

We added a new feature called the "Forecast Card," which shows a visual representation of future rate forecasts. This helps users gain confidence in the projected output and make informed decisions about the market's direction.
Market Conditions Index (MCI)

The Market Conditions Index (MCI) illustrates whether the freight market favors buyers (shippers and brokers) or sellers (carriers). It provides valuable insights for both parties, helping them determine their bargaining power in a specific local market and the effort required to find a trading partner. The MCI is beneficial for brokers, shippers, carriers, and the industry at large, serving as a valuable tool for decision-making and market analysis.
Historical and Forecast Graph

The historical and forecast graphs offer a comprehensive overview of trends over time.
You can easily switch between the Historical and Forecast views. Additionally, you have the option to toggle the shipper carrier contract to observe its trending pattern in comparison to the broker spot rates.
The table maps "Best-Fit Date Returned" to corresponding rates. As the "Best-Fit Date Returned" grows, the rates extend in duration. If the best-fit is 3 days, rates start from 3 days and escalate to 90 days. As the best-fit date lengthens, the shortest rate matches it, and the longest rates may show "No Display".
For those users that subscribe to Ratecast, you can also view forecasted rates by selecting the filters in the upper-right corner.

You can choose to view a 35-day forecast, a 13-month forecast, or a hybrid view that shows historical and forecasted combined.
Attribute Rates
Attribute Rates provide market benchmarks for specialized freight services, including Hazmat and Expedited/Team shipments. Powered by the same contributed transaction data as DAT iQ RateView, these benchmarks offer additional pricing context for loads with specialized transportation requirements.