
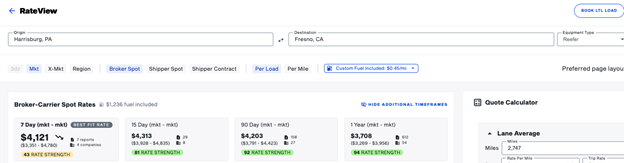
The Rate Strength Score is a metric in RateView that indicates how dependable a lane’s rate estimate is. The score ranges from 0 to 100 and reflects the quality of the data used to calculate the market rate.
The score evaluates three factors:
Availability
The Rate Strength Score is available for:
- RateView Pro
- RateView Premium
Note: This feature is not available for Basic tier users.
Understanding the score
Score Range | Level | Interpretation |
80–100 | High | Stable market rates supported by strong, diverse data. |
60–79 | Moderate | Reliable rate data with moderate volatility or limited contributor diversity. |
40–59 | Low | Limited or emerging data; treat the rate as directional guidance. |
Below 40 | Very Low | Highly volatile or thin data; manual review is recommended. |
How the score is determined
The Rate Strength Score adjusts for three data quality factors.
- Volatility: Large price swings between reports lower the score.
- Number of reports: More reports increase confidence in the market average and can offset volatility.
- Contributor diversity: Data reported by many companies increases reliability. If most reports come from only a few companies, the score is reduced.
Hovering over the Rate Strength Score in RateView displays a tooltip explaining the factors influencing that lane’s score.
What the Rate Strength Score does not indicate
The Rate Strength Score measures data reliability, not the final price of a load.
- It does not predict the exact rate you will pay for a shipment.
- It is not a statistical accuracy percentage.
- It is not a guarantee that a truck can be booked at that rate.
A low score means the data supporting the rate is limited or unstable.
A high score means the market data behind the rate is consistent and well distributed across reporters.